Created by

Software Mansion

LiveView debugging made simple

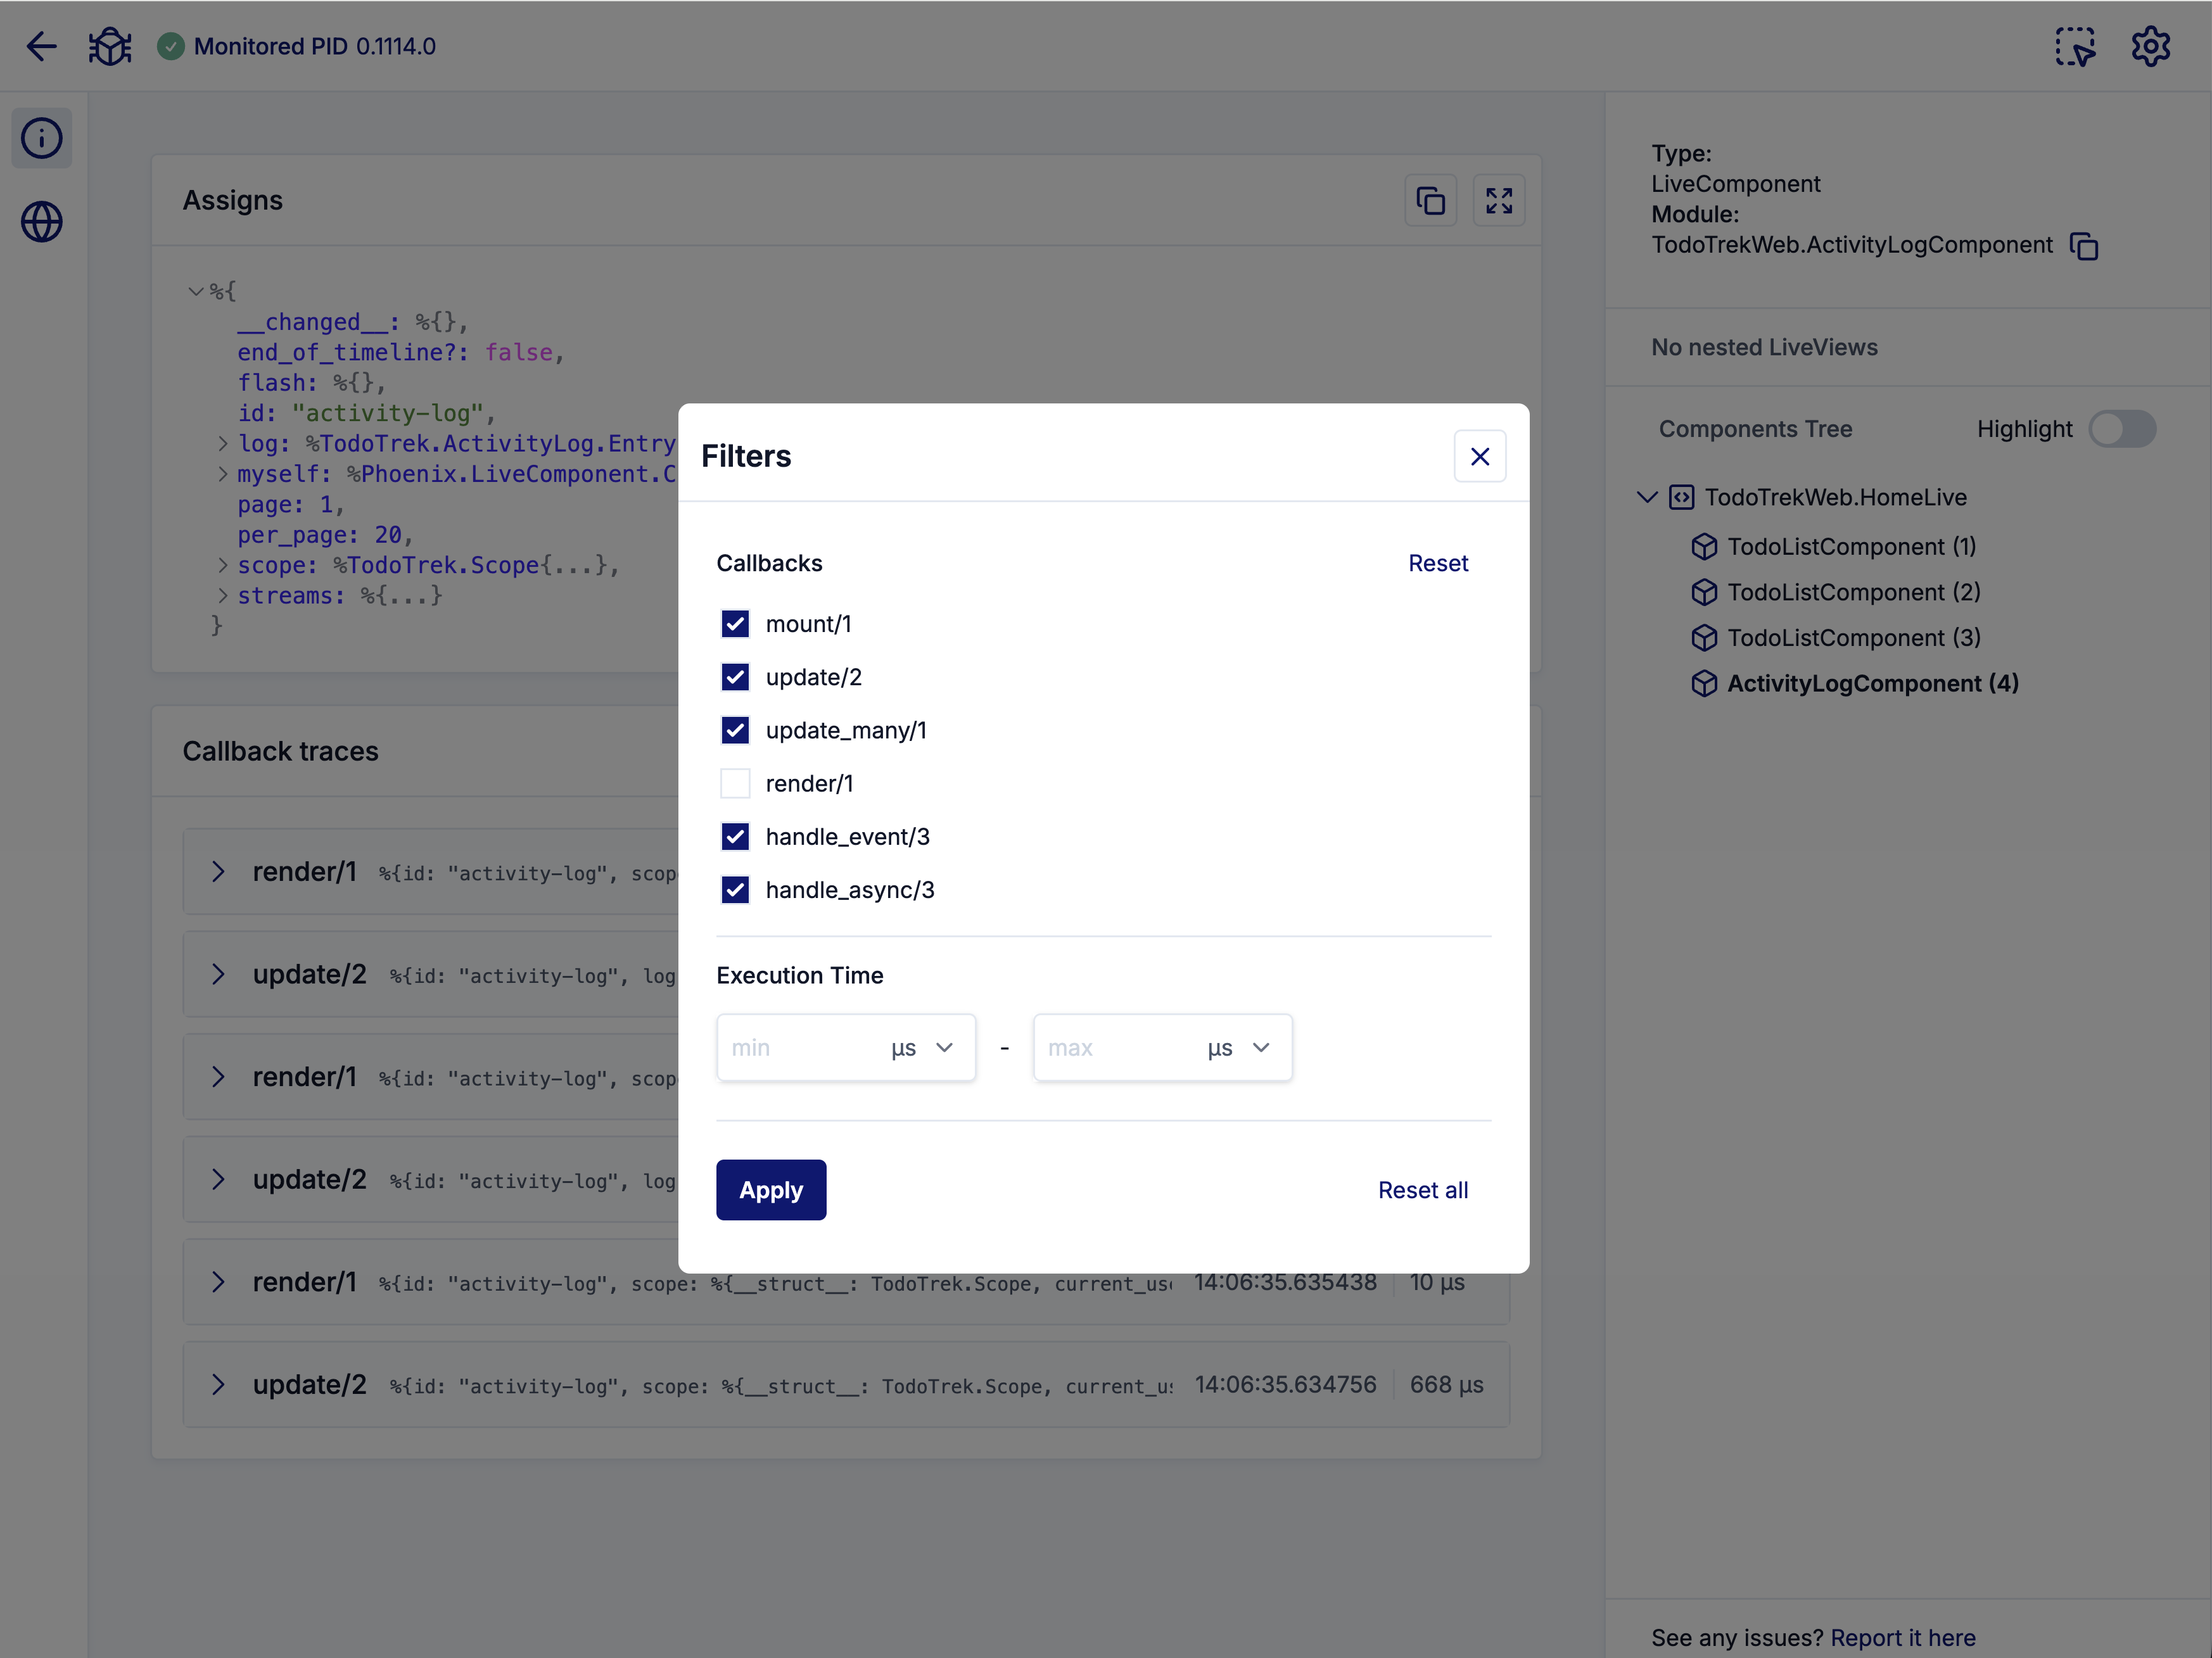
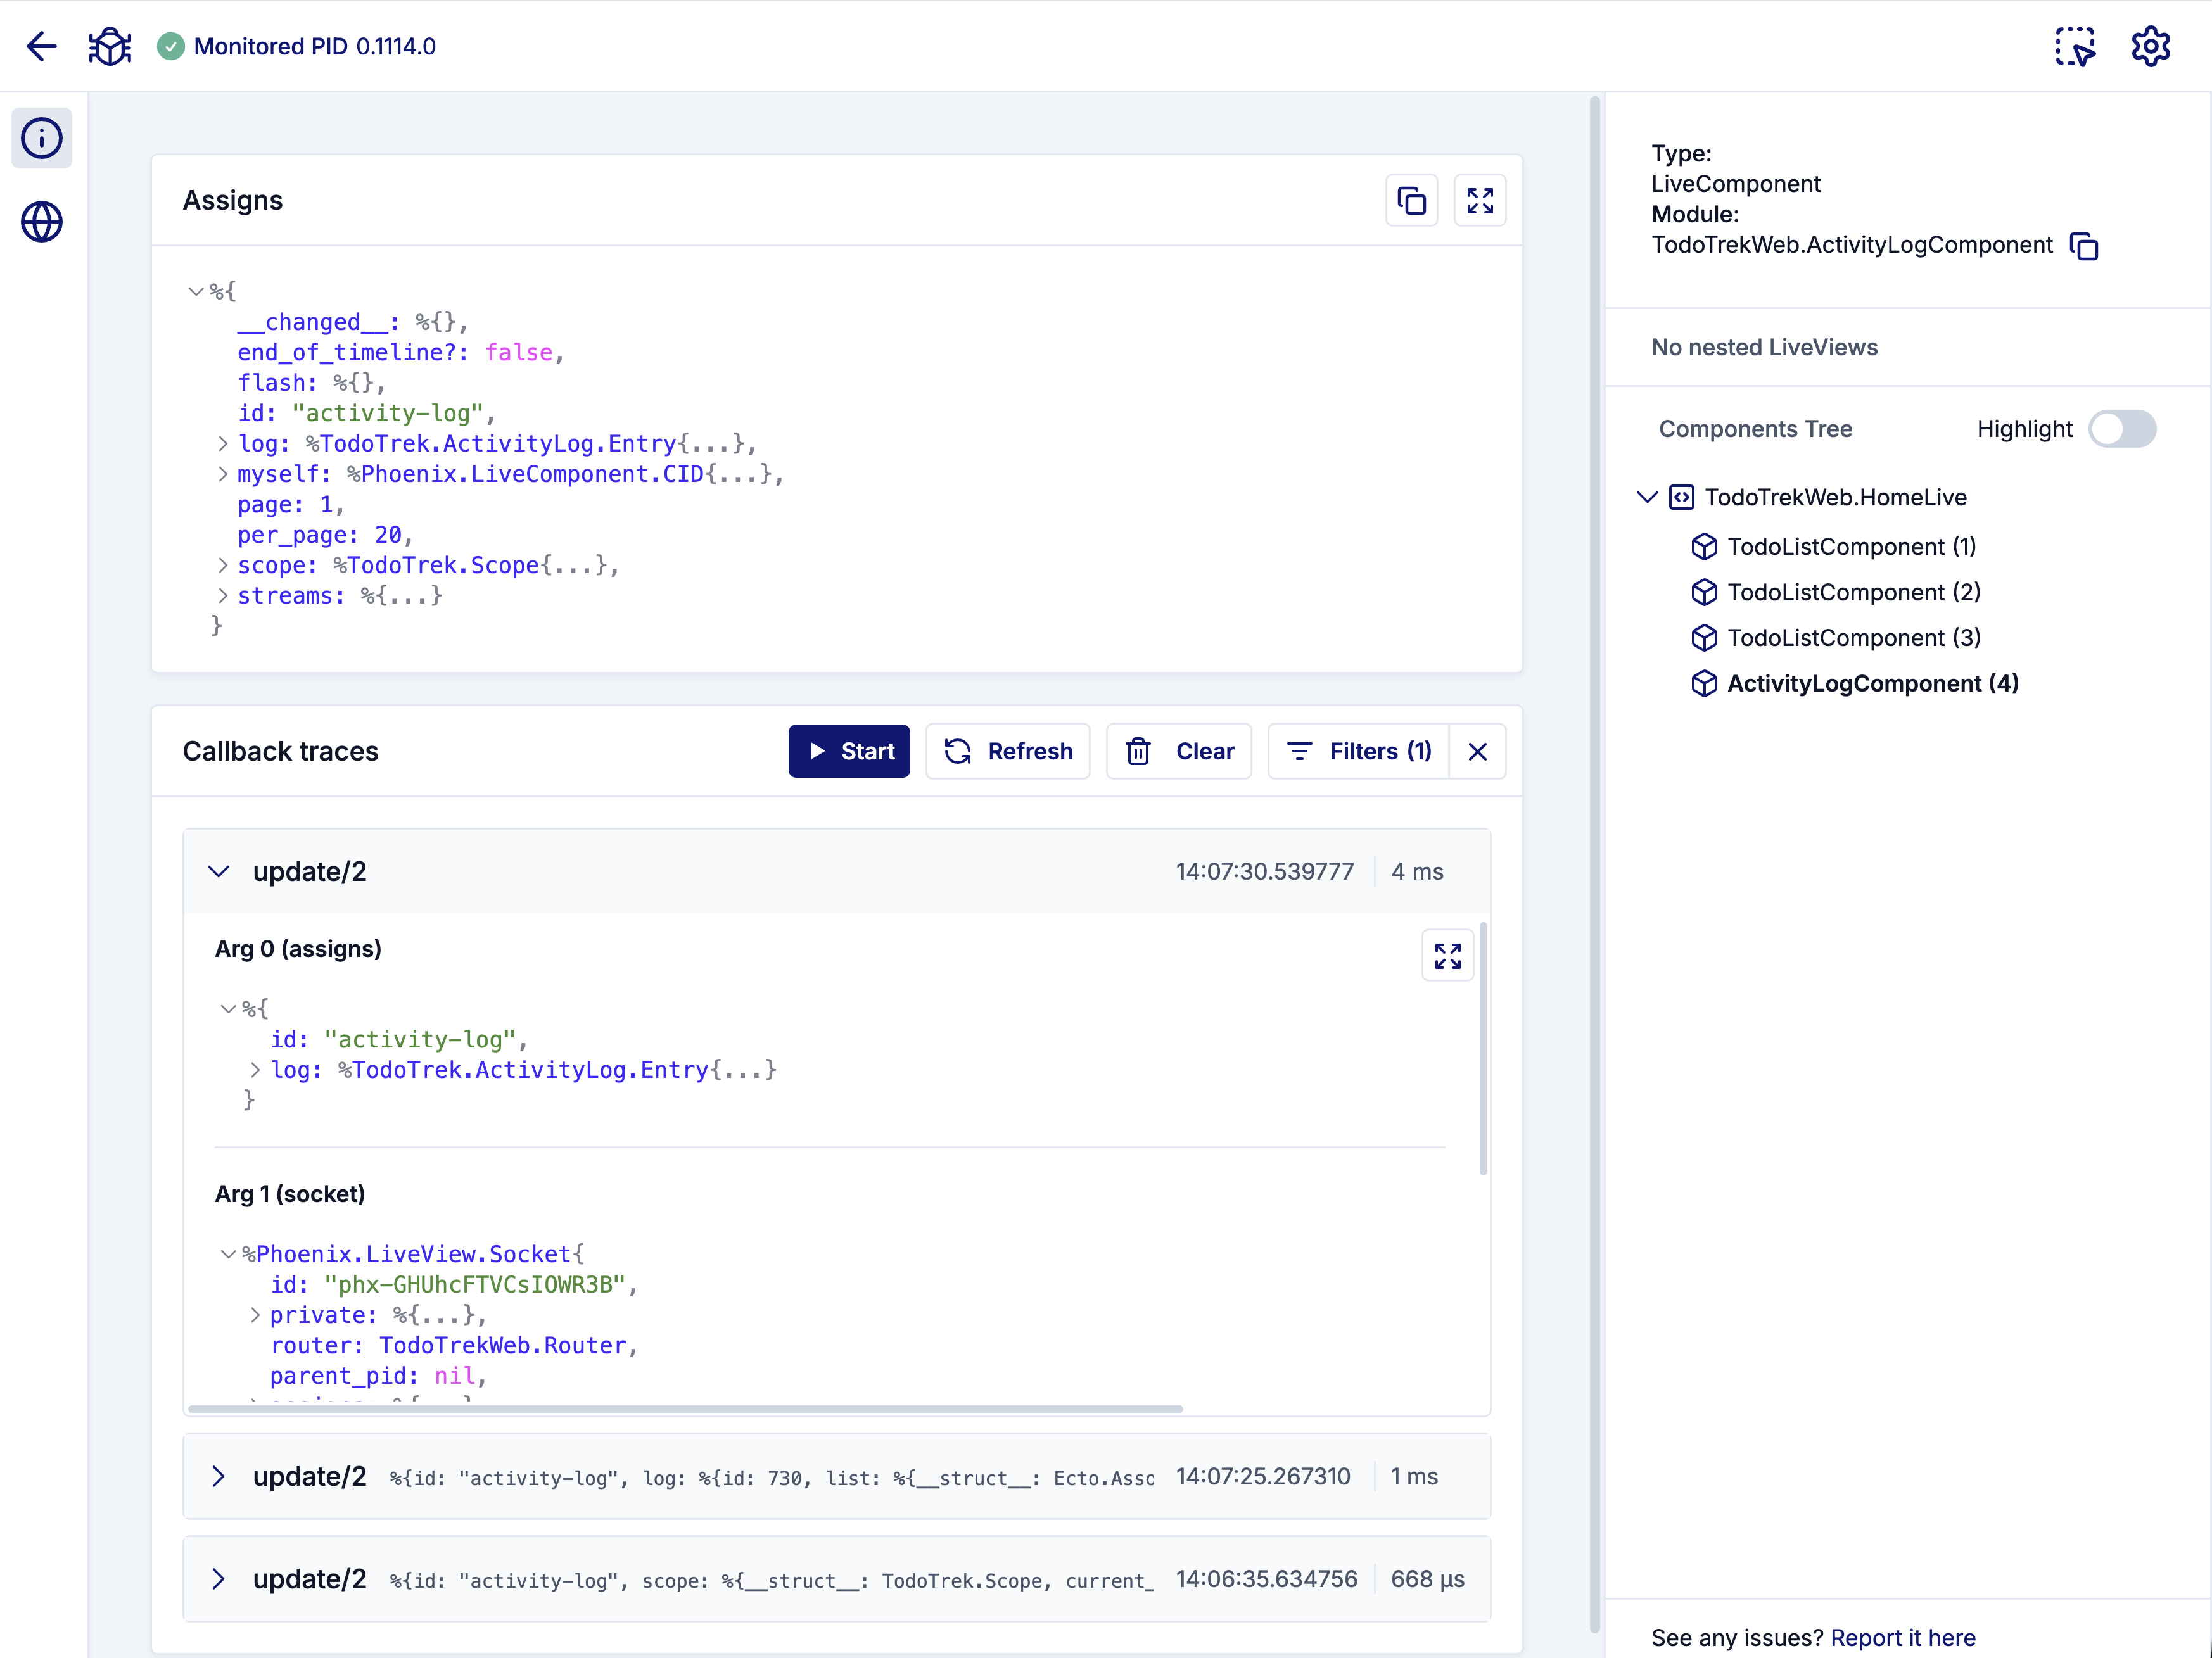
See what’s happening inside your apps with LiveDebugger

Main features

See your LiveComponents tree

Explore your application’s structure at a glance. See how LiveComponents seamlessly fit together to shape your interface.

Inspect assigns

Check the data of any LiveView or LiveComponent in real time. Track state transitions and understand your data flow in real time.

Trace and filter callback executions

Follow lifecycle callbacks, measure execution time, and analyze performance. Filter events to see what really matters.

Inspect elements

Click on UI elements to reveal which component created them and instantly see how your full interface is structured.

See it in action

Debug case

Step 1

Explore your component structure

Quickly identify where issues originate by navigating your LiveView and component hierarchy.
Explore your component structure
Step 2

Inspect state in real time

Check the current state of affected components and see how it changes as you interact with your app.
Inspect state in real time
Step 3

Filter and focus on key callbacks

Apply filters to isolate the most relevant callbacks for faster debugging.
Filter and focus on key callbacks
Step 4

Observe state transitions and behavior

Watch how each callback impacts your component’s state and behavior.
Observe state transitions and behavior

Watch full video of this case

Getting started

Add live_debugger to your list of dependencies in mix.exs :

defp deps do [ {:live_debugger, "~> 0.4.0", only: :dev} ] end

Add a line to your application root layout. It attaches meta tag and LiveDebugger scripts.

# lib/my_app_web/components/layouts/root.html.heex <head> <%= Application.get_env(:live_debugger, :live_debugger_tags) %> </head>

After you start your application, LiveDebugger will be running at a default port http://localhost:4007.

LiveDebugger v0.4.0

What’s new

Highlights from the August 2025 update.

Better LiveView successor discovery

Improved tracking of LiveView processes when they’re replaced due to actions like page reloads or errors, ensuring smoother debugging transitions.

Inspecting HTML elements

Users can right-click on an HTML element and select “Inspect LiveElement” to identify which LiveView or LiveComponent is responsible for rendering it.

Search in callback traces

Adds a search option that lets users find specific text or phrases within callback traces, making it easier to navigate and analyze complex data flows.

Roadmap

Have a feature idea? Let us know!