Debugging worklets
Due to Reanimated's unique architecture and usage of a second JS runtime, debugging can be problematic, and some common solutions might not work as expected. This article summarizes all the available methods and highlights their caveats.

 info
infoReanimated v1 works with all the common React Native debugging tools. This article focuses on the use of these tools with Reanimated v2.
React Native debugging tools
These are the debugging tools we checked for compatibility with React Native apps using the Reanimated library:
-
Chrome debugger (also known as the React Native Debugger) is a simple tool that creates a web worker inside your preferred browser which executes your app's JavaScript code. It works with all the runtimes available in React Native.
-
Chrome DevTools (unavailable for JSC) is Chrome's built-in feature that allows for connecting to a remote JavaScript runtime. This means that the code you are debugging actually runs on the device itself and behaves the same way as it would with DevTools detached.
-
Flipper (Hermes debugger) is an app created by Facebook that makes it easy to use the Chrome DevTools while providing additional tools for UI inspection and debugging.
-
Safari DevTools is Safari's built-in feature that is only available for iOS devices running JSC. It works very similarly to Chrome DevTools - it allows you to connect to a remote runtime and keep code execution on device.
-
React Developer Tools are a standalone app that allows debugging UI through the inspector, as well as monitoring performance and profiling your app.
The JS context vs. the UI context
It is important to understand the differences between the JS and UI contexts. One thing to note is that adding Reanimated changes nothing when it comes to debugging the regular JS context that is available in all React Native apps. It is only debugging the UI context, which is specific to the Reanimated library that might be difficult to debug in some scenarios, which are all explained in this article.
Debugging web apps
For debugging web apps, you may use the tools you prefer or any that are provided by the browser of your choice. We did not discover any issues with debugging apps using Reanimated on web.
Summary
| Tool | Platform | JSC | Hermes | V8 |
|---|---|---|---|---|
| Chrome debugger | Android | ⚛️ ✅ ¹ | ⚛️ ✅ ¹ | ⚛️ ✅ ¹ |
| iOS | ⚛️ ✅ ¹ | ⚛️ ✅ ¹ | N/A | |
| Chrome DevTools | Android | N/A | ⚛️ ✅ ² | ⚛️ |
| iOS | N/A | ⚛️ ✅ ² | N/A | |
| Flipper (Hermes debugger) | Android | N/A | ⚛️ ✅ ² | ⚛️ |
| iOS | N/A | ⚛️ ✅ ² | N/A | |
| Safari DevTools | Android | N/A | N/A | N/A |
| iOS | ⚛️ ✅ | N/A | N/A | |
| React Developer Tools | Android | ⚛️ | ⚛️ | ⚛️ |
| iOS | ⚛️ | ⚛️ | N/A |
² - Experimental feature (see description).
Legend:
- ⚛️ ✅ - special features for React Native apps using Reanimated
- ⚛️ - works the same as with all React Native apps, debugging worklets is not available
- N/A - unavailable in React Native apps
cautionRemember that console logs will always appear in the primary JS runtime as the
console.log function on the UI runtime is just a wrapper around the one from
the JS runtime.
Chrome Debugger
| Platform | JSC | Hermes | V8 |
|---|---|---|---|
| Android | ⚛️ ✅ | ⚛️ ✅ | ⚛️ ✅ |
| iOS | ⚛️ ✅ | ⚛️ ✅ | N/A |
Summary: Works, but uses web implementations of functions and runs everything on the JS thread.
Since the Chrome Debugger runs its own web worker, all the code is run on the JS thread, and it uses the JavaScript engine provided by your web browser (V8 in Chrome, JSC in Safari and SpiderMonkey in Firefox). This means that this piece of code:
function runWorklet() {
  'worklet';
  console.log('worklet:', _WORKLET);
}
runOnUI(runWorklet)();
would output:
LOG: worklet: false
Another side effect is that Reanimated uses web implementations of all
functions. This means that the scrollTo function will work
(using the native web implementation), but the measure
function will not be available, and its usage will trigger this error:
[Reanimated] measure() cannot be used with Chrome Debugger.
You may still use the standard web version of measure as described
here.
Those functions that are provided by Reanimated and do not have web
implementations won't work at all.
An example of this behavior is the useAnimatedSensor hook,
which currently only works on mobile platforms. When debugging in Chrome and using
this hook, the following message will appear in the logs:
[Reanimated] useAnimatedSensor is not available on web yet.
But despite all of this, it is still possible to set breakpoints both in normal JS code and in worklets (since they run on the main JS thread now).
Chrome DevTools
| Platform | JSC | Hermes | V8 |
|---|---|---|---|
| Android | N/A | ⚛️ ✅ | ⚛️ |
| iOS | N/A | ⚛️ ✅ | N/A |
Summary: Works and both contexts can be debugged.
warningThis is an early experimental feature.
Worklet debugging is now available in Reanimated apps as an early experimental feature. We do not recommend using Chrome DevTools to debug the UI context, but instead try using the Flipper tool. It has fewer bugs and provides a much better experience.
If you still want to use Chrome DevTools then follow these steps:
-
Add the
patch-packageto your project and set it up to run as apost-installtask. More details can be found here. -
Add the necessary patch for
metro-inspector-proxyto thepatches/folder:
0.76.7→ here0.76.5→ here0.76.4→ here0.76.0→ here0.73.7→ here0.73.5→ here0.72.3→ here0.72.1→ here
Warnings about mismatched patch versions can be safely ignored if the patch was successfully applied.
-
Open chrome://inspect in a Google Chrome browser.
-
Select the Reanimated runtime from the list. The list should look something like this:
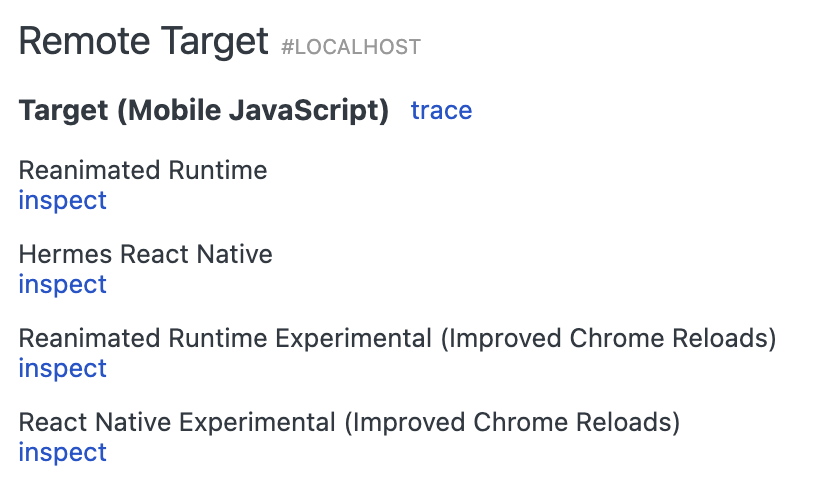
You may choose either Reanimated Runtime or Reanimated Runtime experimental (Improved Chrome Reloads), but we recommend the latter.
Debugging relies on source maps that are generated by the Reanimated Babel plugin, so you
might have to run yarn start --reset-cache for those changes to take effect.
In case it still doesn't work after that please reinstall the app and reset metro
cache once again.
cautionKnown issues include:
-
Reloads don't work - if a debugger is connected to the Reanimated runtime while the reload is performed, the app will crash (both on Android and iOS)
-
On iOS, a breakpoint can't be set in a line where a breakpoint was previously set and then removed
-
On iOS, breakpoint labels are not visible
-
The profiler does not work (it is not possible to stop the recording) - this is an issue with Hermes and is not related to Reanimated and has been already fixed in this PR
-
The console is unresponsive if there are no animations running (this will be fixed in the near future)
These issues do not affect release builds as well as debug builds where the debugger connection is closed while performing a reload or the debugger is not used at all.
We are actively working on improving the debugging experience with Chrome DevTools on Hermes.
Flipper (Hermes debugger)
| Platform | JSC | Hermes | V8 |
|---|---|---|---|
| Android | N/A | ⚛️ ✅ | ⚛️ |
| iOS | N/A | ⚛️ ✅ | N/A |
Summary: Works and both contexts can be debugged.
warningThis is an early experimental feature.
Worklet debugging is now available in Reanimated apps as an early experimental feature. If you want to try it out follow these steps:
-
Add the
patch-packageto your project and set it up to run as apost-installtask. More details can be found here; -
Add the necessary patches to the
patches/folder:
- this patch for
metro-inspector-proxy, - this one for
react-native-gesture-handler(not necessary forreact-native-gesture-handler2.7.0 or newer).
Warnings about mismatched patch versions can be safely ignored if the patch was successfully applied.
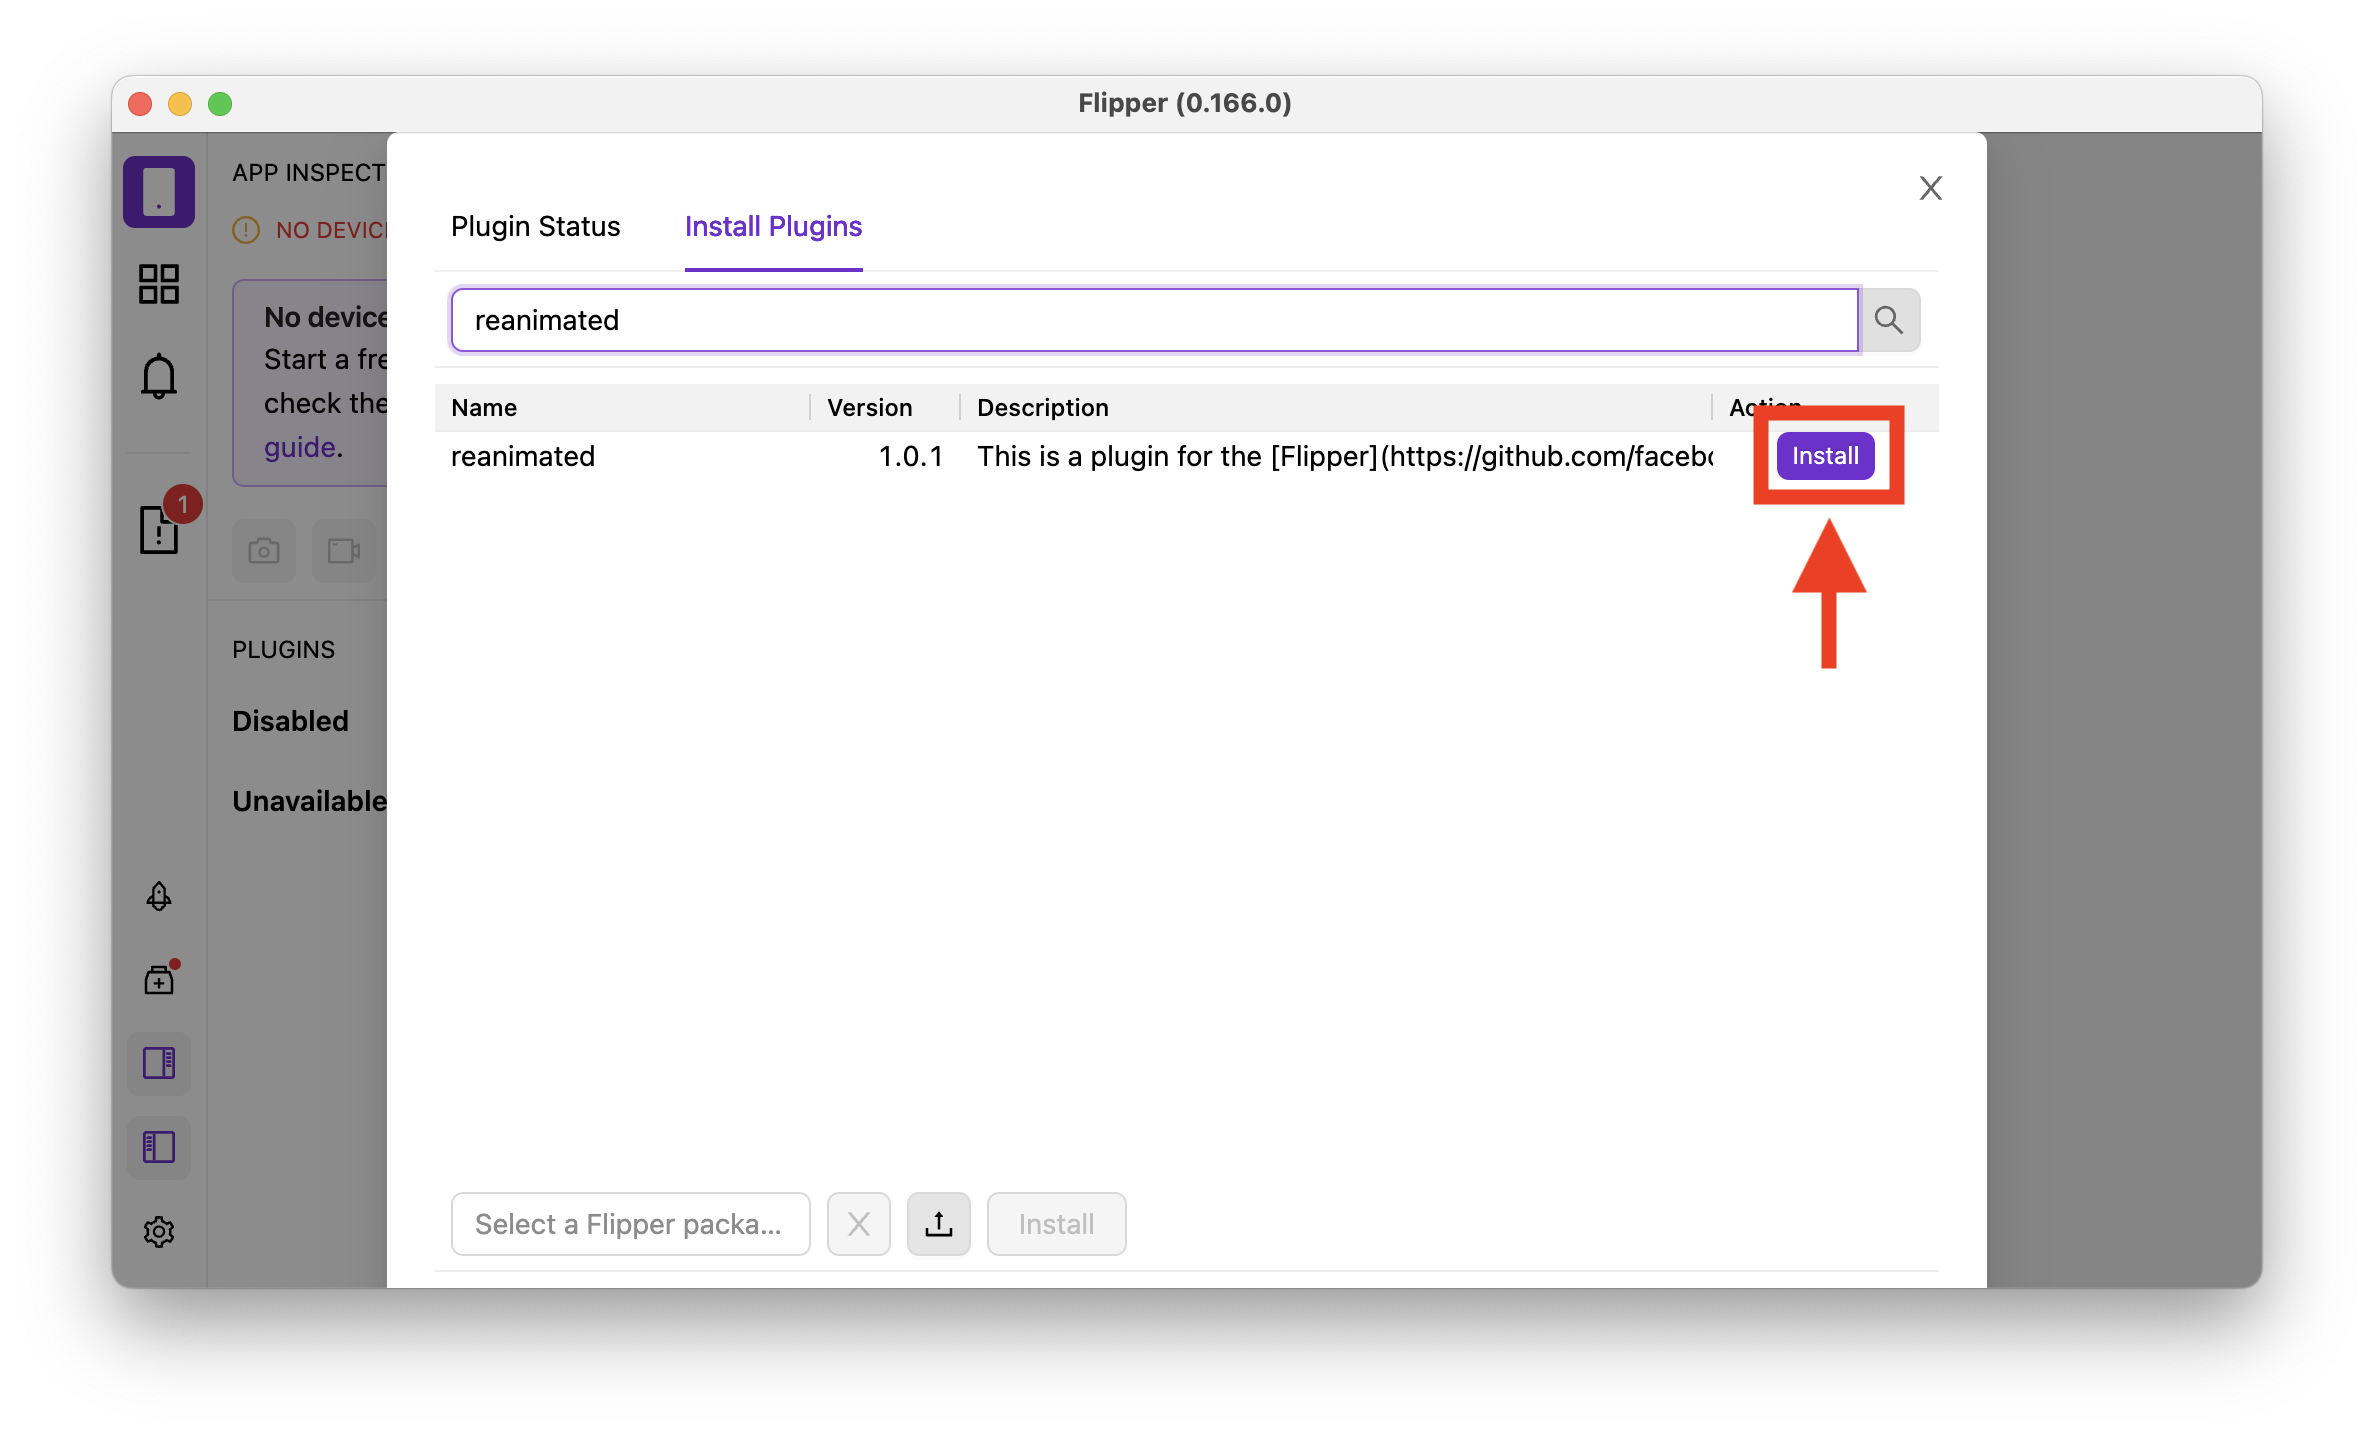
- Install the
reanimatedplugin in Flipper.
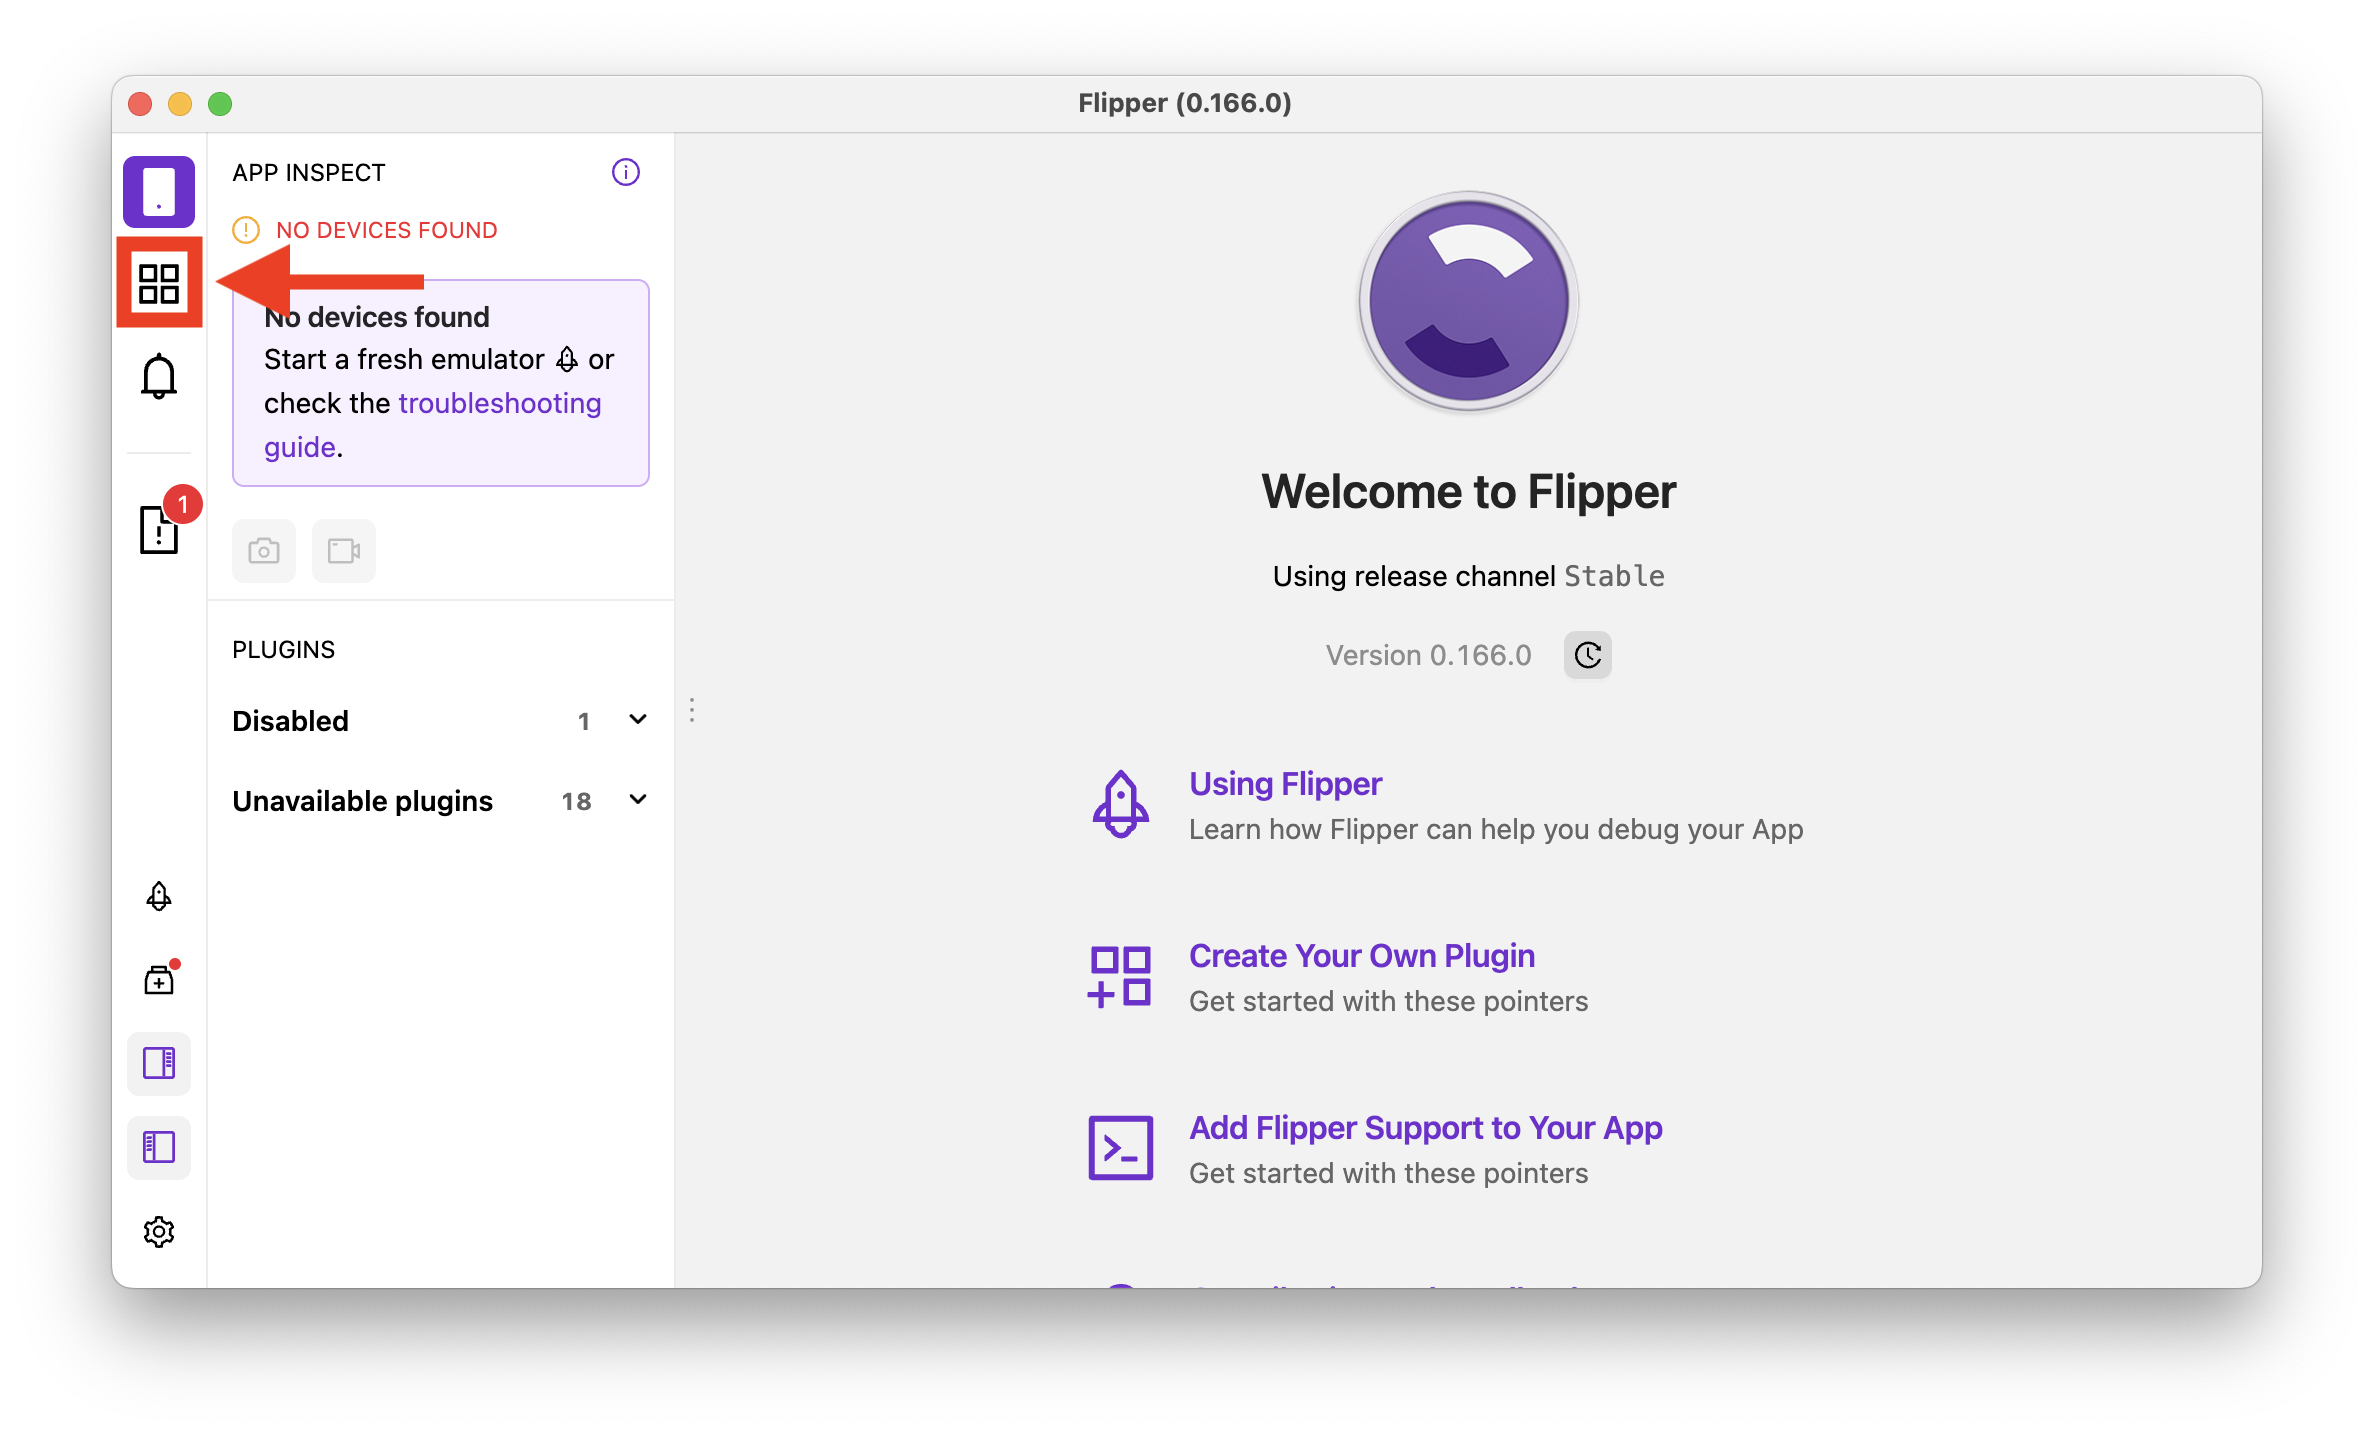
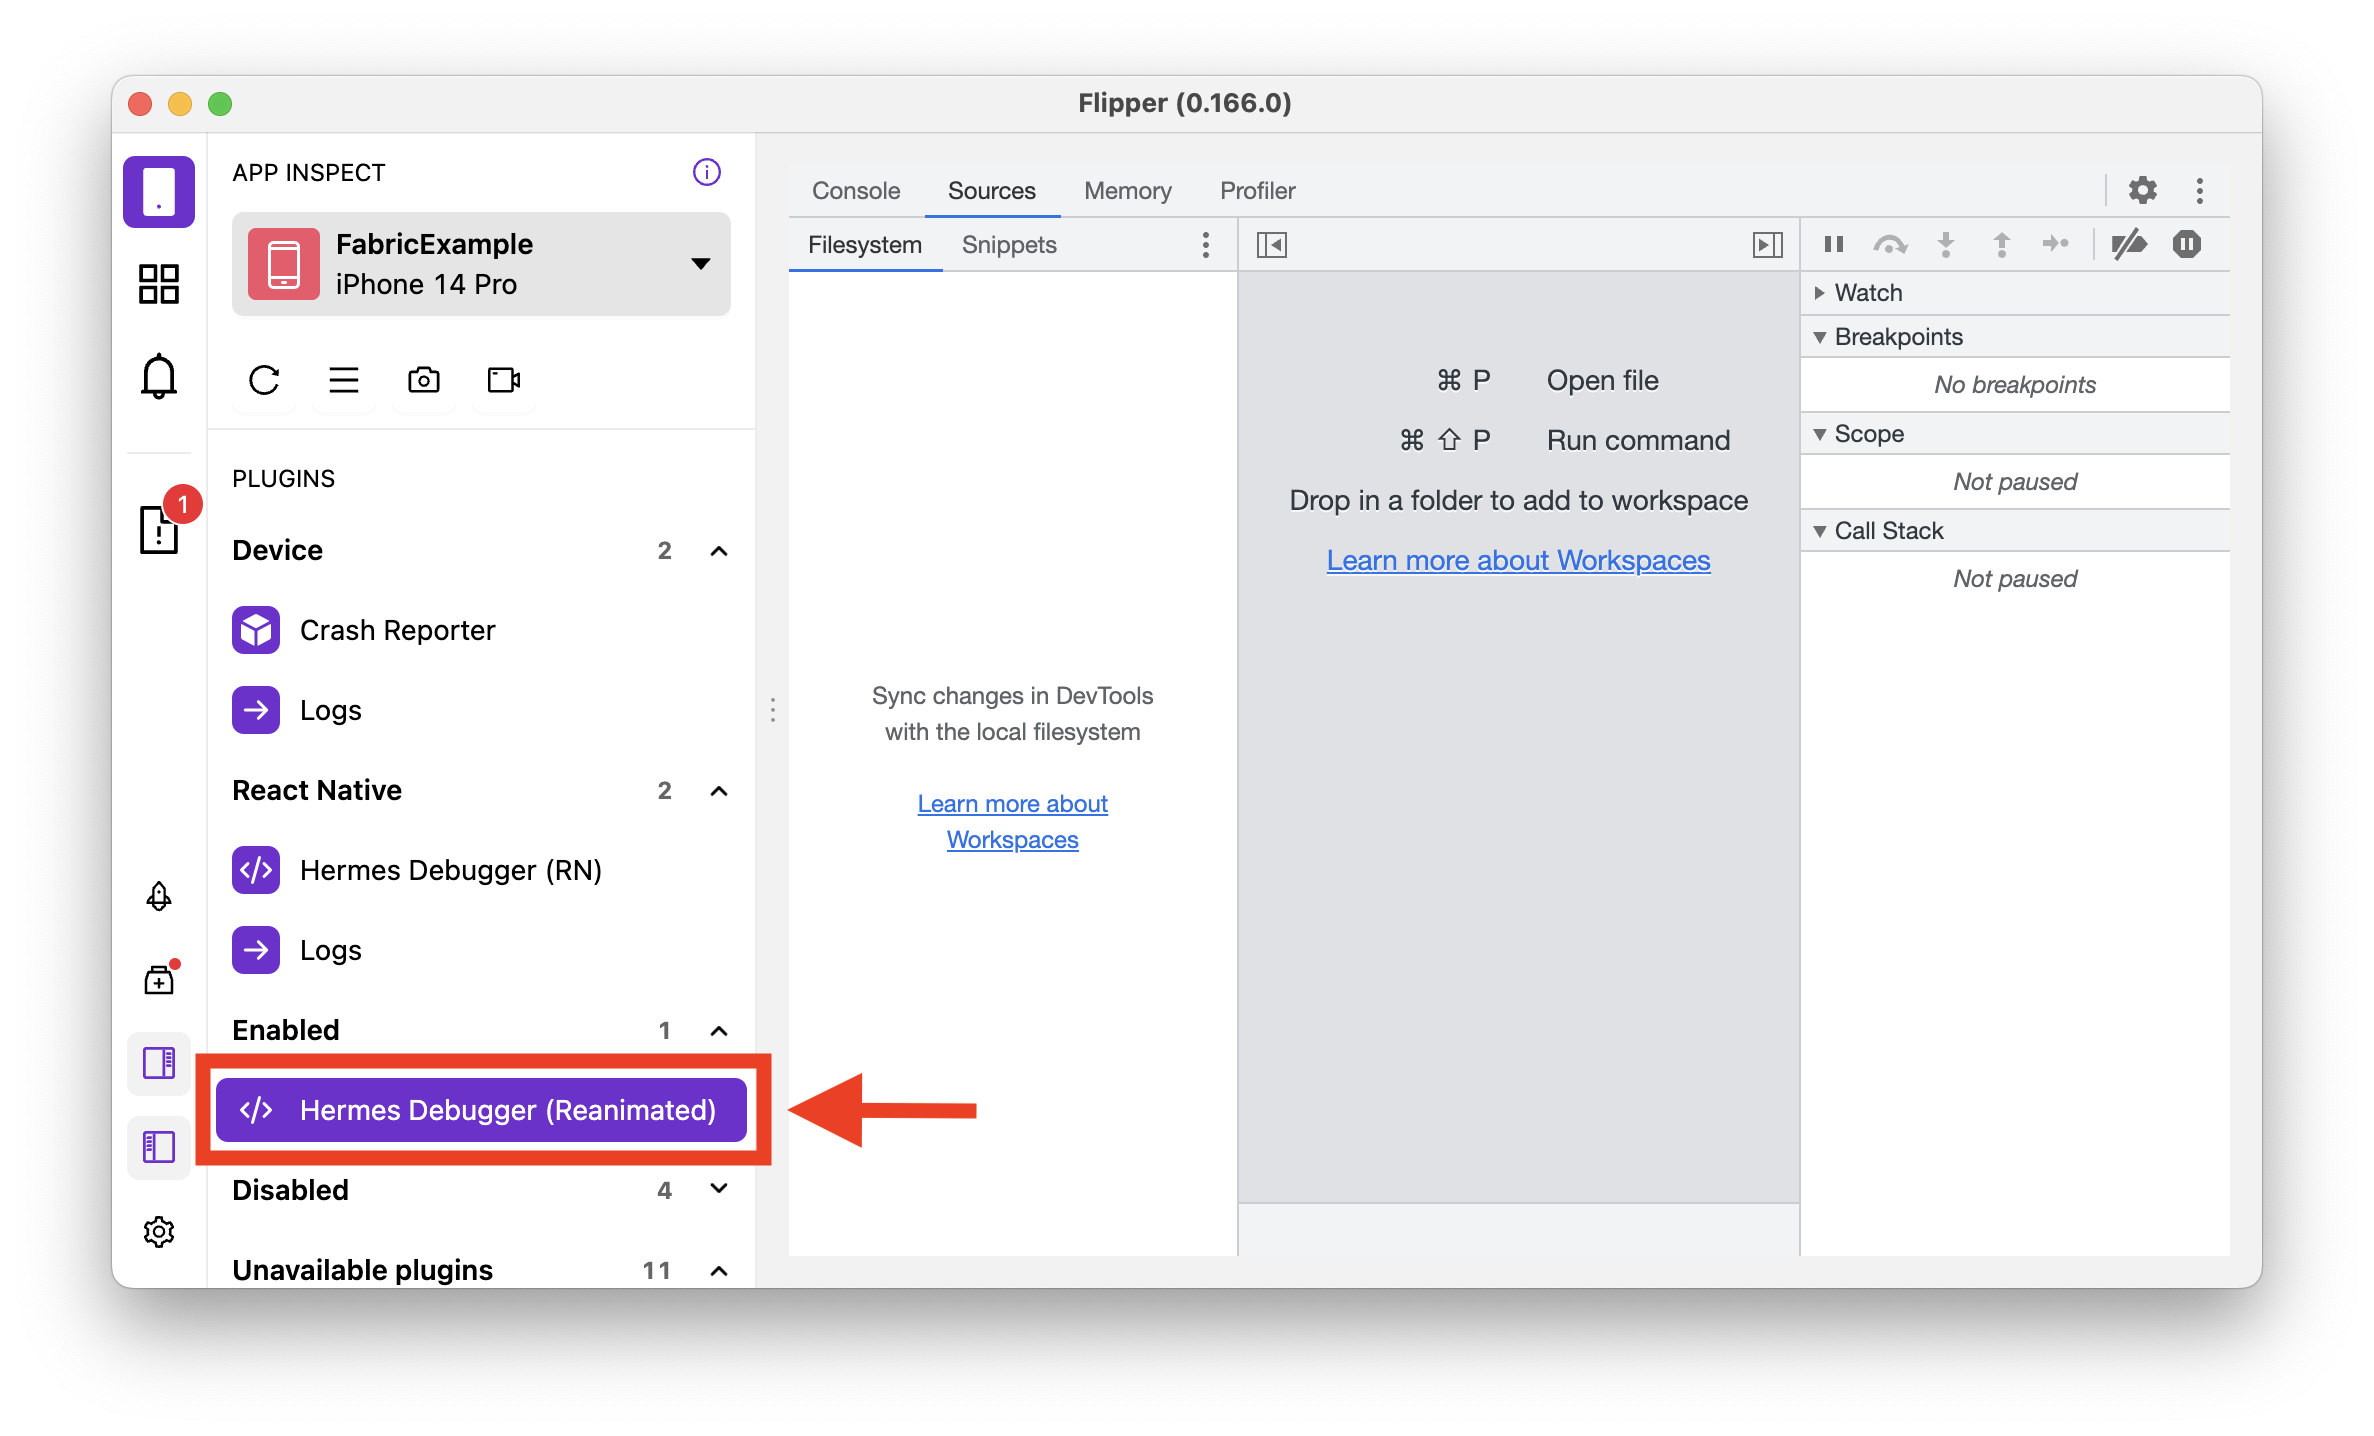
- Select the plugin from the side menu (it might be disabled) and you should be good to go!
Debugging relies on source maps that are generated by the Reanimated Babel plugin, so you
might have to run yarn start --reset-cache for those changes to take effect.
In case it still doesn't work after that please reinstall the app and reset metro
cache once again.
cautionKnown issues include:
-
Reloads don't work - if a debugger is connected to the Reanimated runtime while the reload is performed, the app will crash (both on Android and iOS)
-
Breakpoints might not be active after a reload even though they look as if they were
-
Android app crashes after the Flipper client is closed and will crash on startup after that. This is a known Flipper issue (link) and is not related to Reanimated.
-
The profiler does not work (it is not possible to stop the recording) - this is an issue with Hermes and is not related to Reanimated and has been already fixed in this PR
-
The console is unresponsive if there are no animations running (this will be fixed in the near future)
These issues do not affect release builds as well as debug builds where the debugger connection is closed while performing a reload or the debugger is not used at all.
We are actively working on improving the debugging experience with Flipper on Hermes.
Safari DevTools
| Platform | JSC | Hermes | V8 |
|---|---|---|---|
| Android | N/A | N/A | N/A |
| iOS | ⚛️ ✅ | N/A | N/A |
Summary: Safari DevTools is only available on iOS devices running the JSC engine. Worklet debugging is available.
After opening Safari and configuring it as specified in the React Native
docs, under Develop > Device you'll see two JSC contexts
like in the screenshot below:
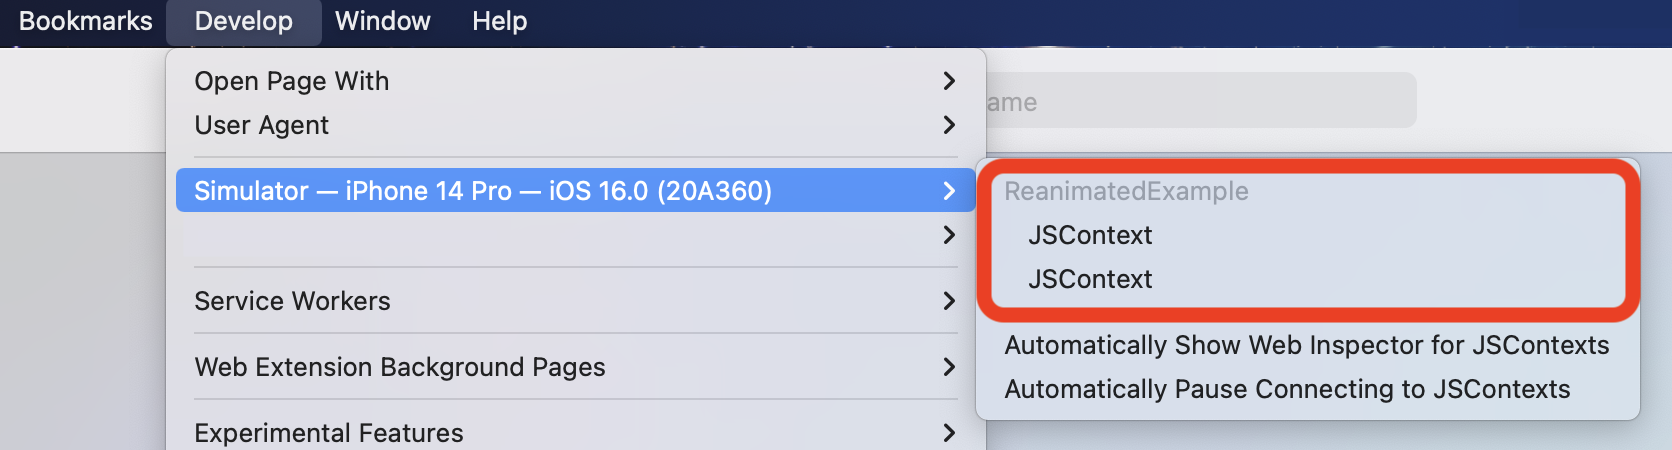
The order of the contexts is random, but one of them will be the main JS context.
All console.log outputs will appear in the console of this context. You can also
set breakpoints here, but unfortunately the only source file visible is the
transformed indexjs.bundle which does make things more difficult to find.
The other option will be the UI context. No console logs will appear in the console of this context, but all worklet functions should be visible as separate files. It is also possible to set breakpoints in these worklets.
React Developer Tools
| Platform | JSC | Hermes | V8 |
|---|---|---|---|
| Android | ⚛️ | ⚛️ | ⚛️ |
| iOS | ⚛️ | ⚛️ | N/A |
Summary: React Developer Tools work as expected, and the profiler and layout inspector can be used as usual.
On Android, remember to first run the command:
adb reverse tcp:8097 tcp:8097